Your Child’s WVGSA Report, Explained — Section by Section
Three03Lab Team · · 9 min read
A few times a year, a packet comes home. Your child’s name is on it, along with a number you’ve never seen before, a phrase like Partially Meets Standard, and a note from the teacher saying this is only one measure of achievement.
Most of us read the phrase, feel briefly good or briefly worried, and put the whole thing in a drawer.
That’s a waste, because there is real information in there. It just isn’t where your eye goes first. This is a walk through the entire report — every section, what it means, and what to do with it — written for West Virginia parents by one.
First: two tests, one report design
Two things get confused constantly, so let’s separate them.
The WVGSA — the West Virginia General Summative Assessment — is the online state test all public school students in grades 3–8 take each spring in ELA and math, plus science in grades 5 and 8. It’s the one that counts for accountability.
A benchmark is a shorter check-in given during the school year against the same standards, so teachers can see how students are tracking while there’s still time to change something.
They produce nearly identical-looking reports, and everything below applies to both. The difference is what you should conclude. A summative score is a summary of a year. A benchmark is a starting position.
A map of the page
Before the detail, here’s the shape of the thing. Six zones.
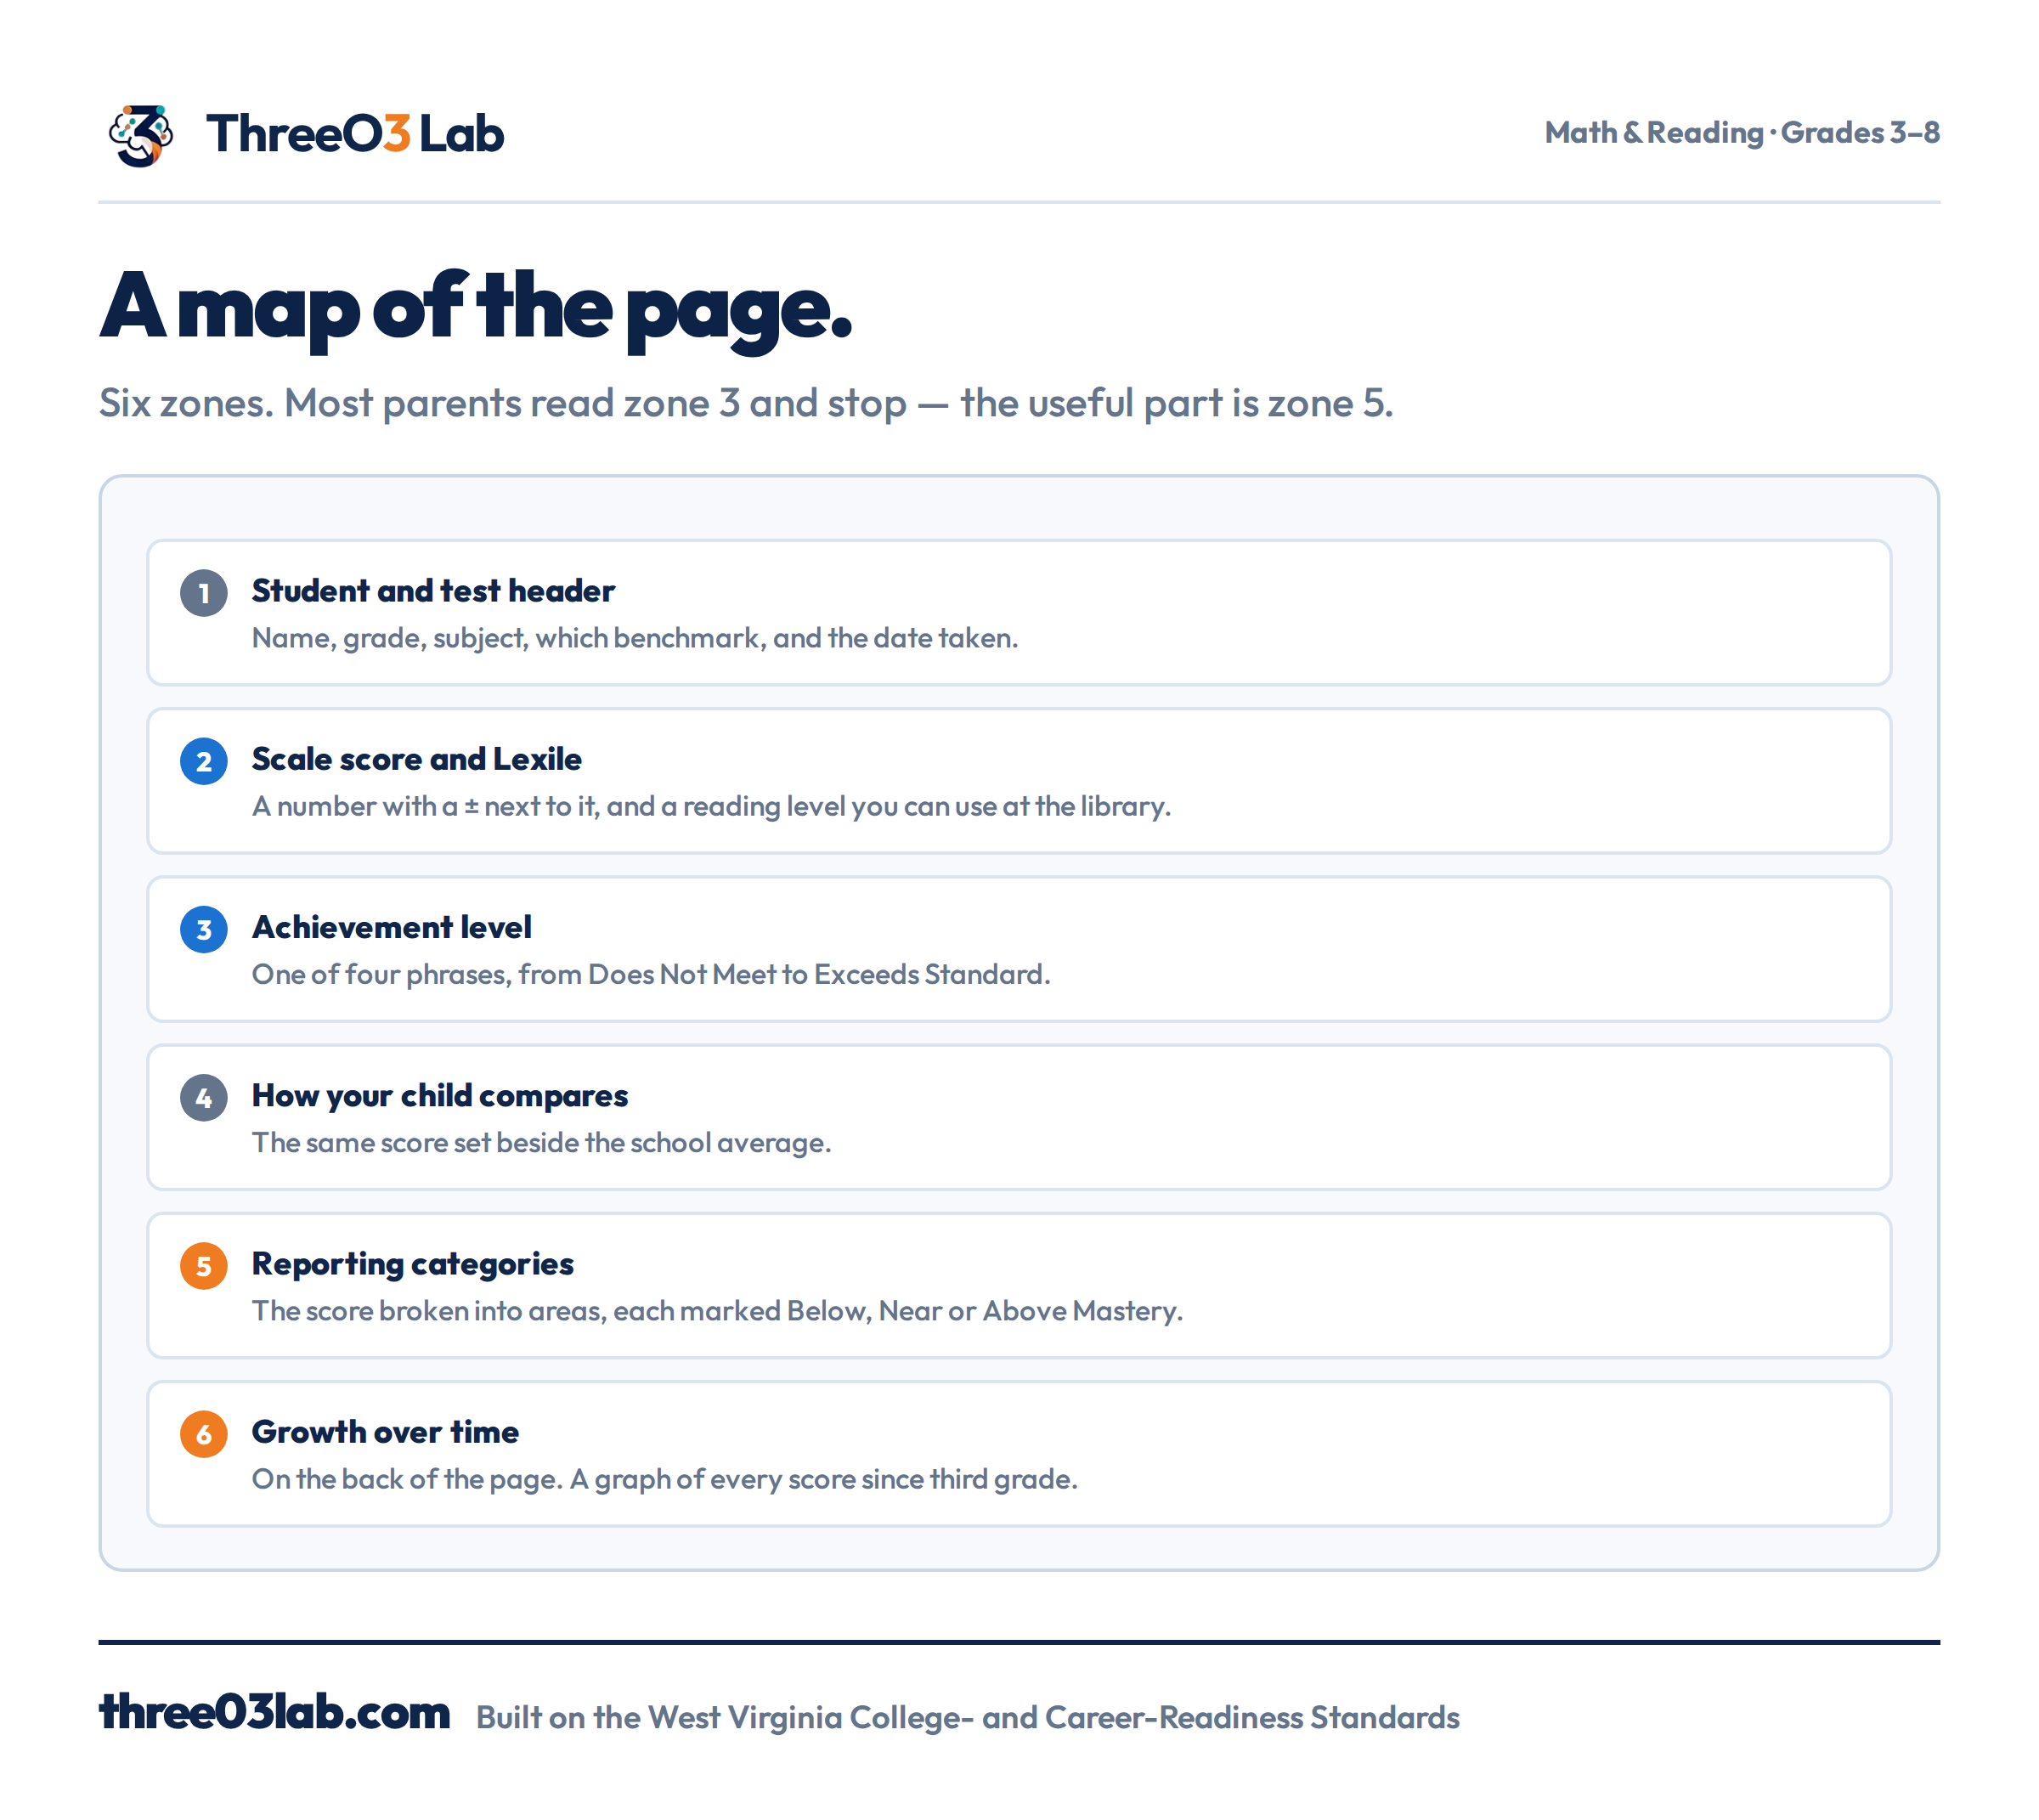
Zone 2 — The scale score, and the small number beside it
Near the top you’ll find something like Scale Score: 611 ±12.
Almost everyone reads the 611 and skips the ±12. The ±12 is the more important number.
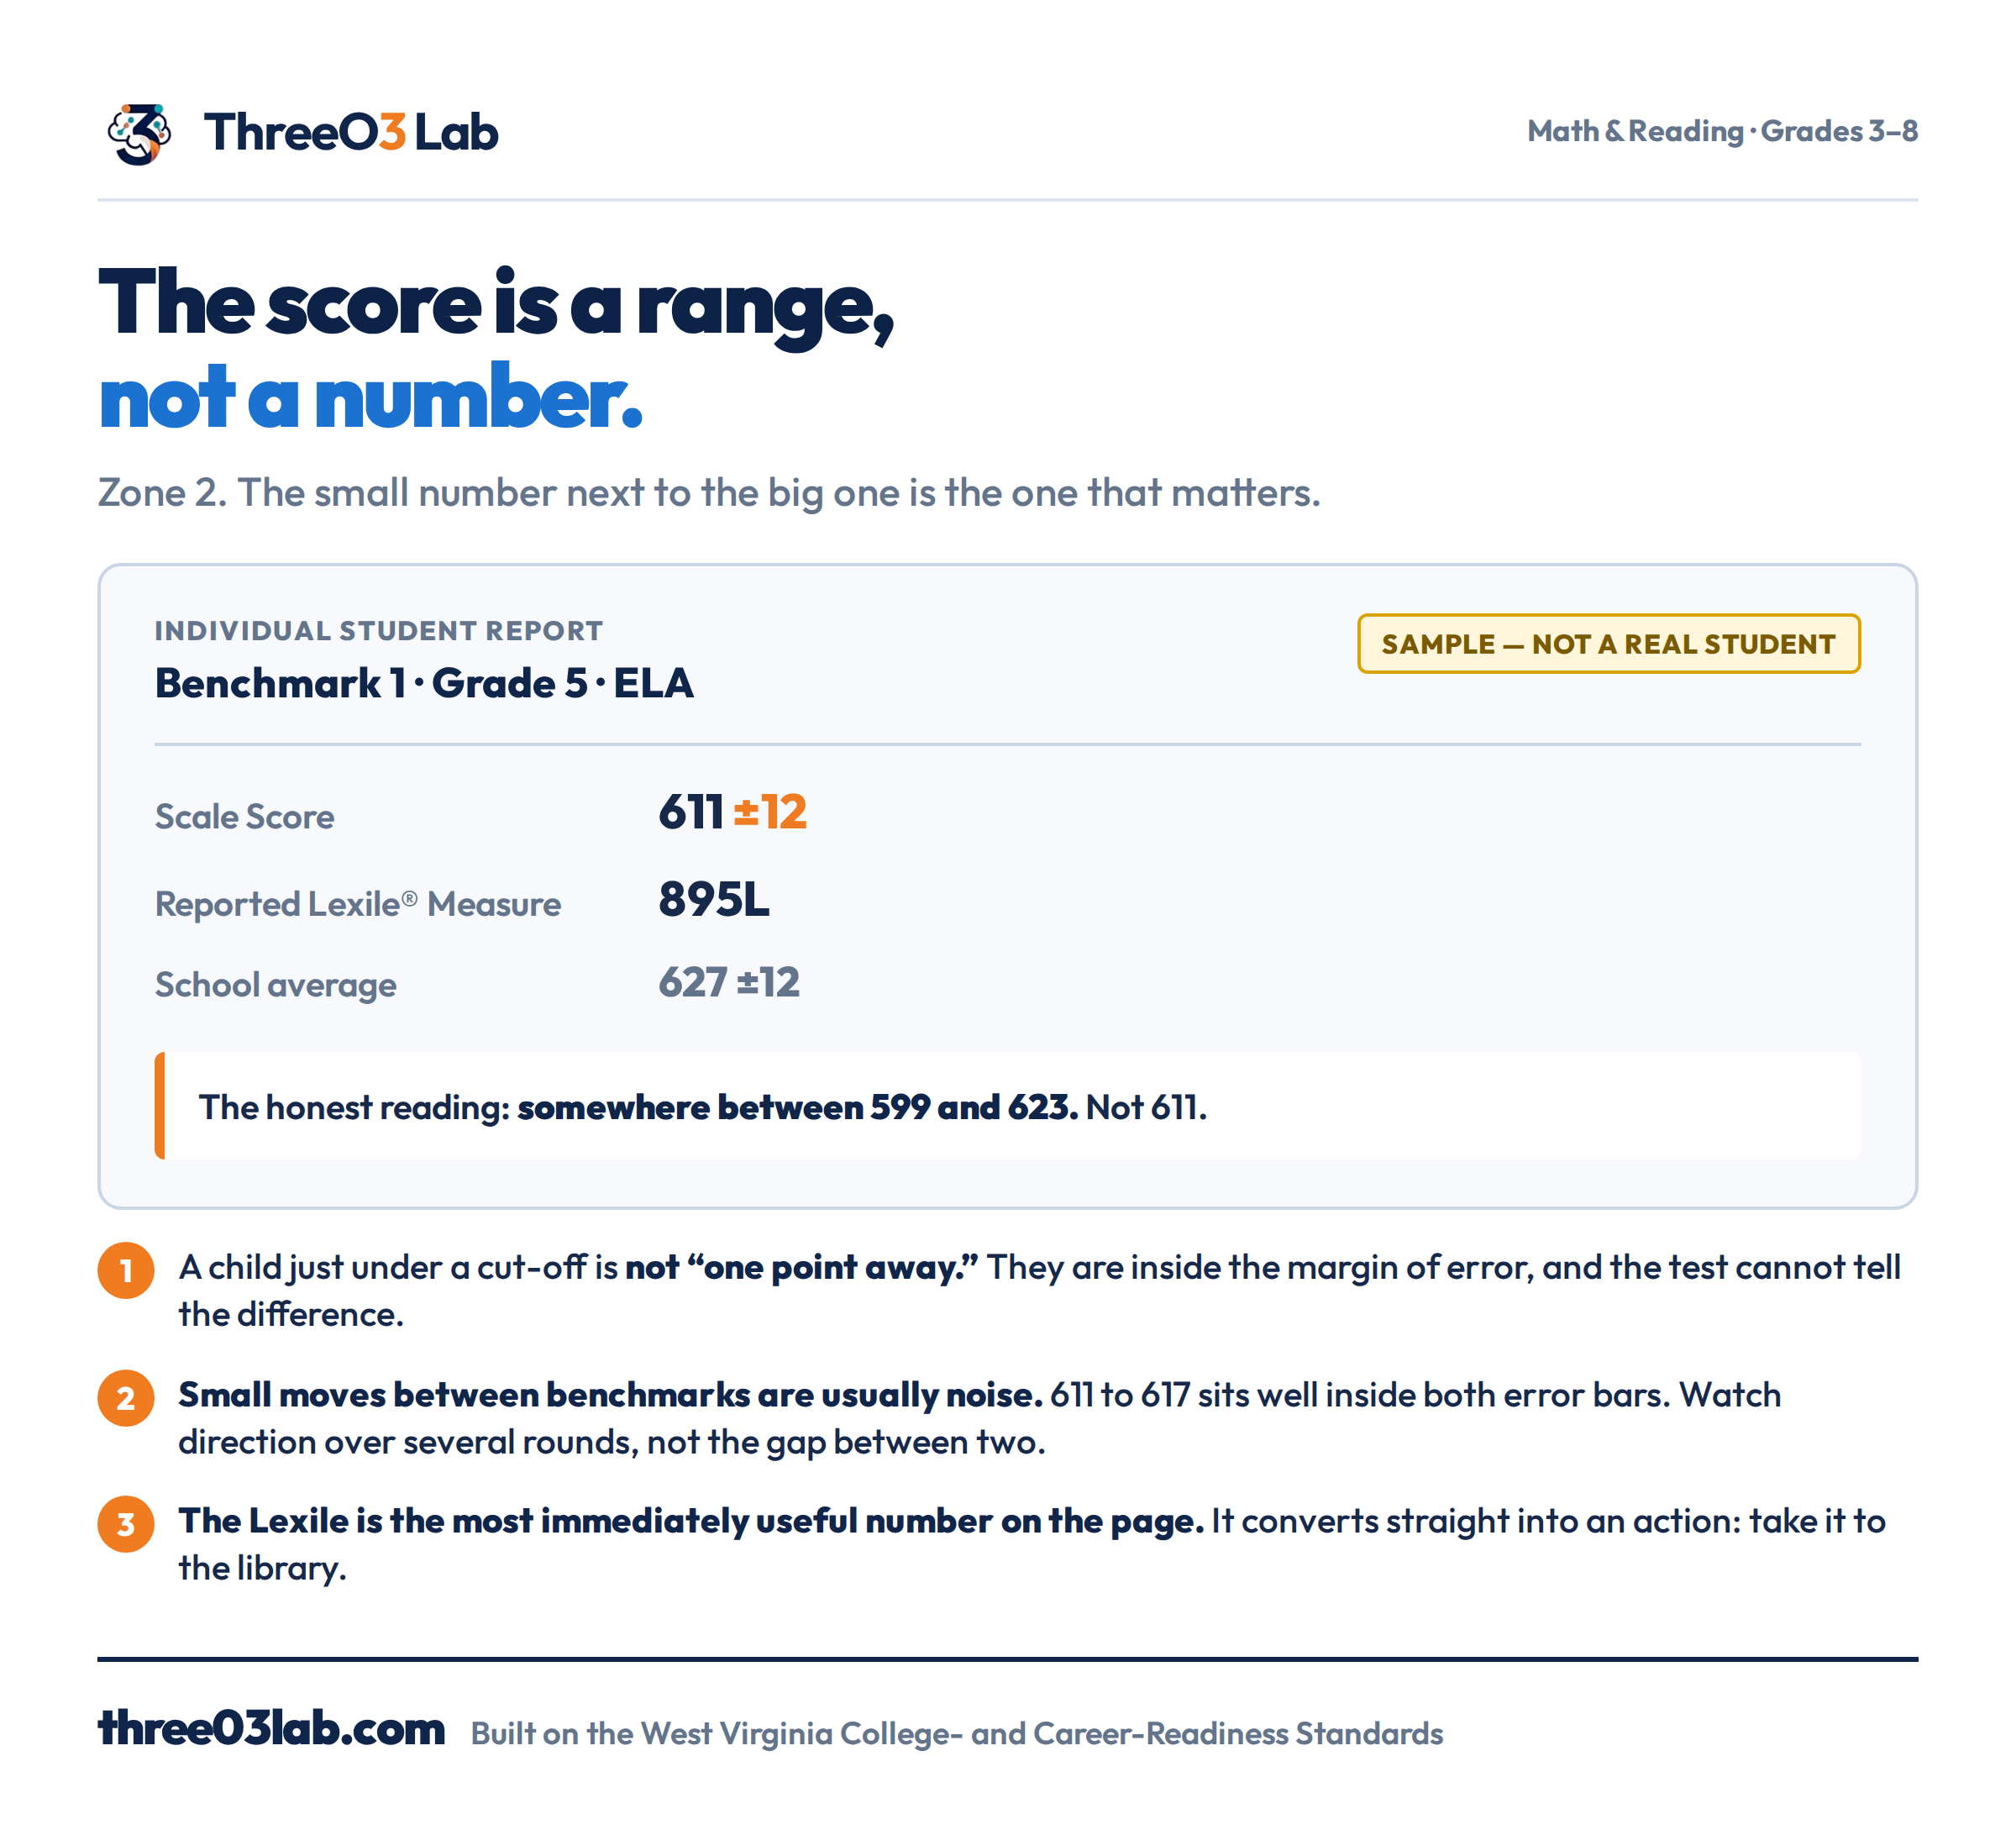
That’s the standard error of measurement, and it’s the test being honest about its own precision. Your child’s actual ability is estimated to sit somewhere between 599 and 623 — not at exactly 611. The report says as much in its own small print.
Three consequences worth carrying with you.
- A child just below a cut-off is not “one point away.” They’re inside the margin of error. The same child on a different form of the same test the following week could land on the other side of the line with nothing about them having changed.
- Small movements between benchmarks are usually noise. 611 to 617 sits well inside both error bars. Look at direction across several rounds, not the gap between any two.
- The Lexile is the most immediately useful number on the page. It’s a reading level, and it converts straight into an action: take it to the library and use it to pick books. Math reports carry an equivalent called a Quantile.
Zone 3 — The achievement level
Next comes one of four phrases, each with a paragraph explaining it in terms of the West Virginia College- and Career-Readiness Standards.
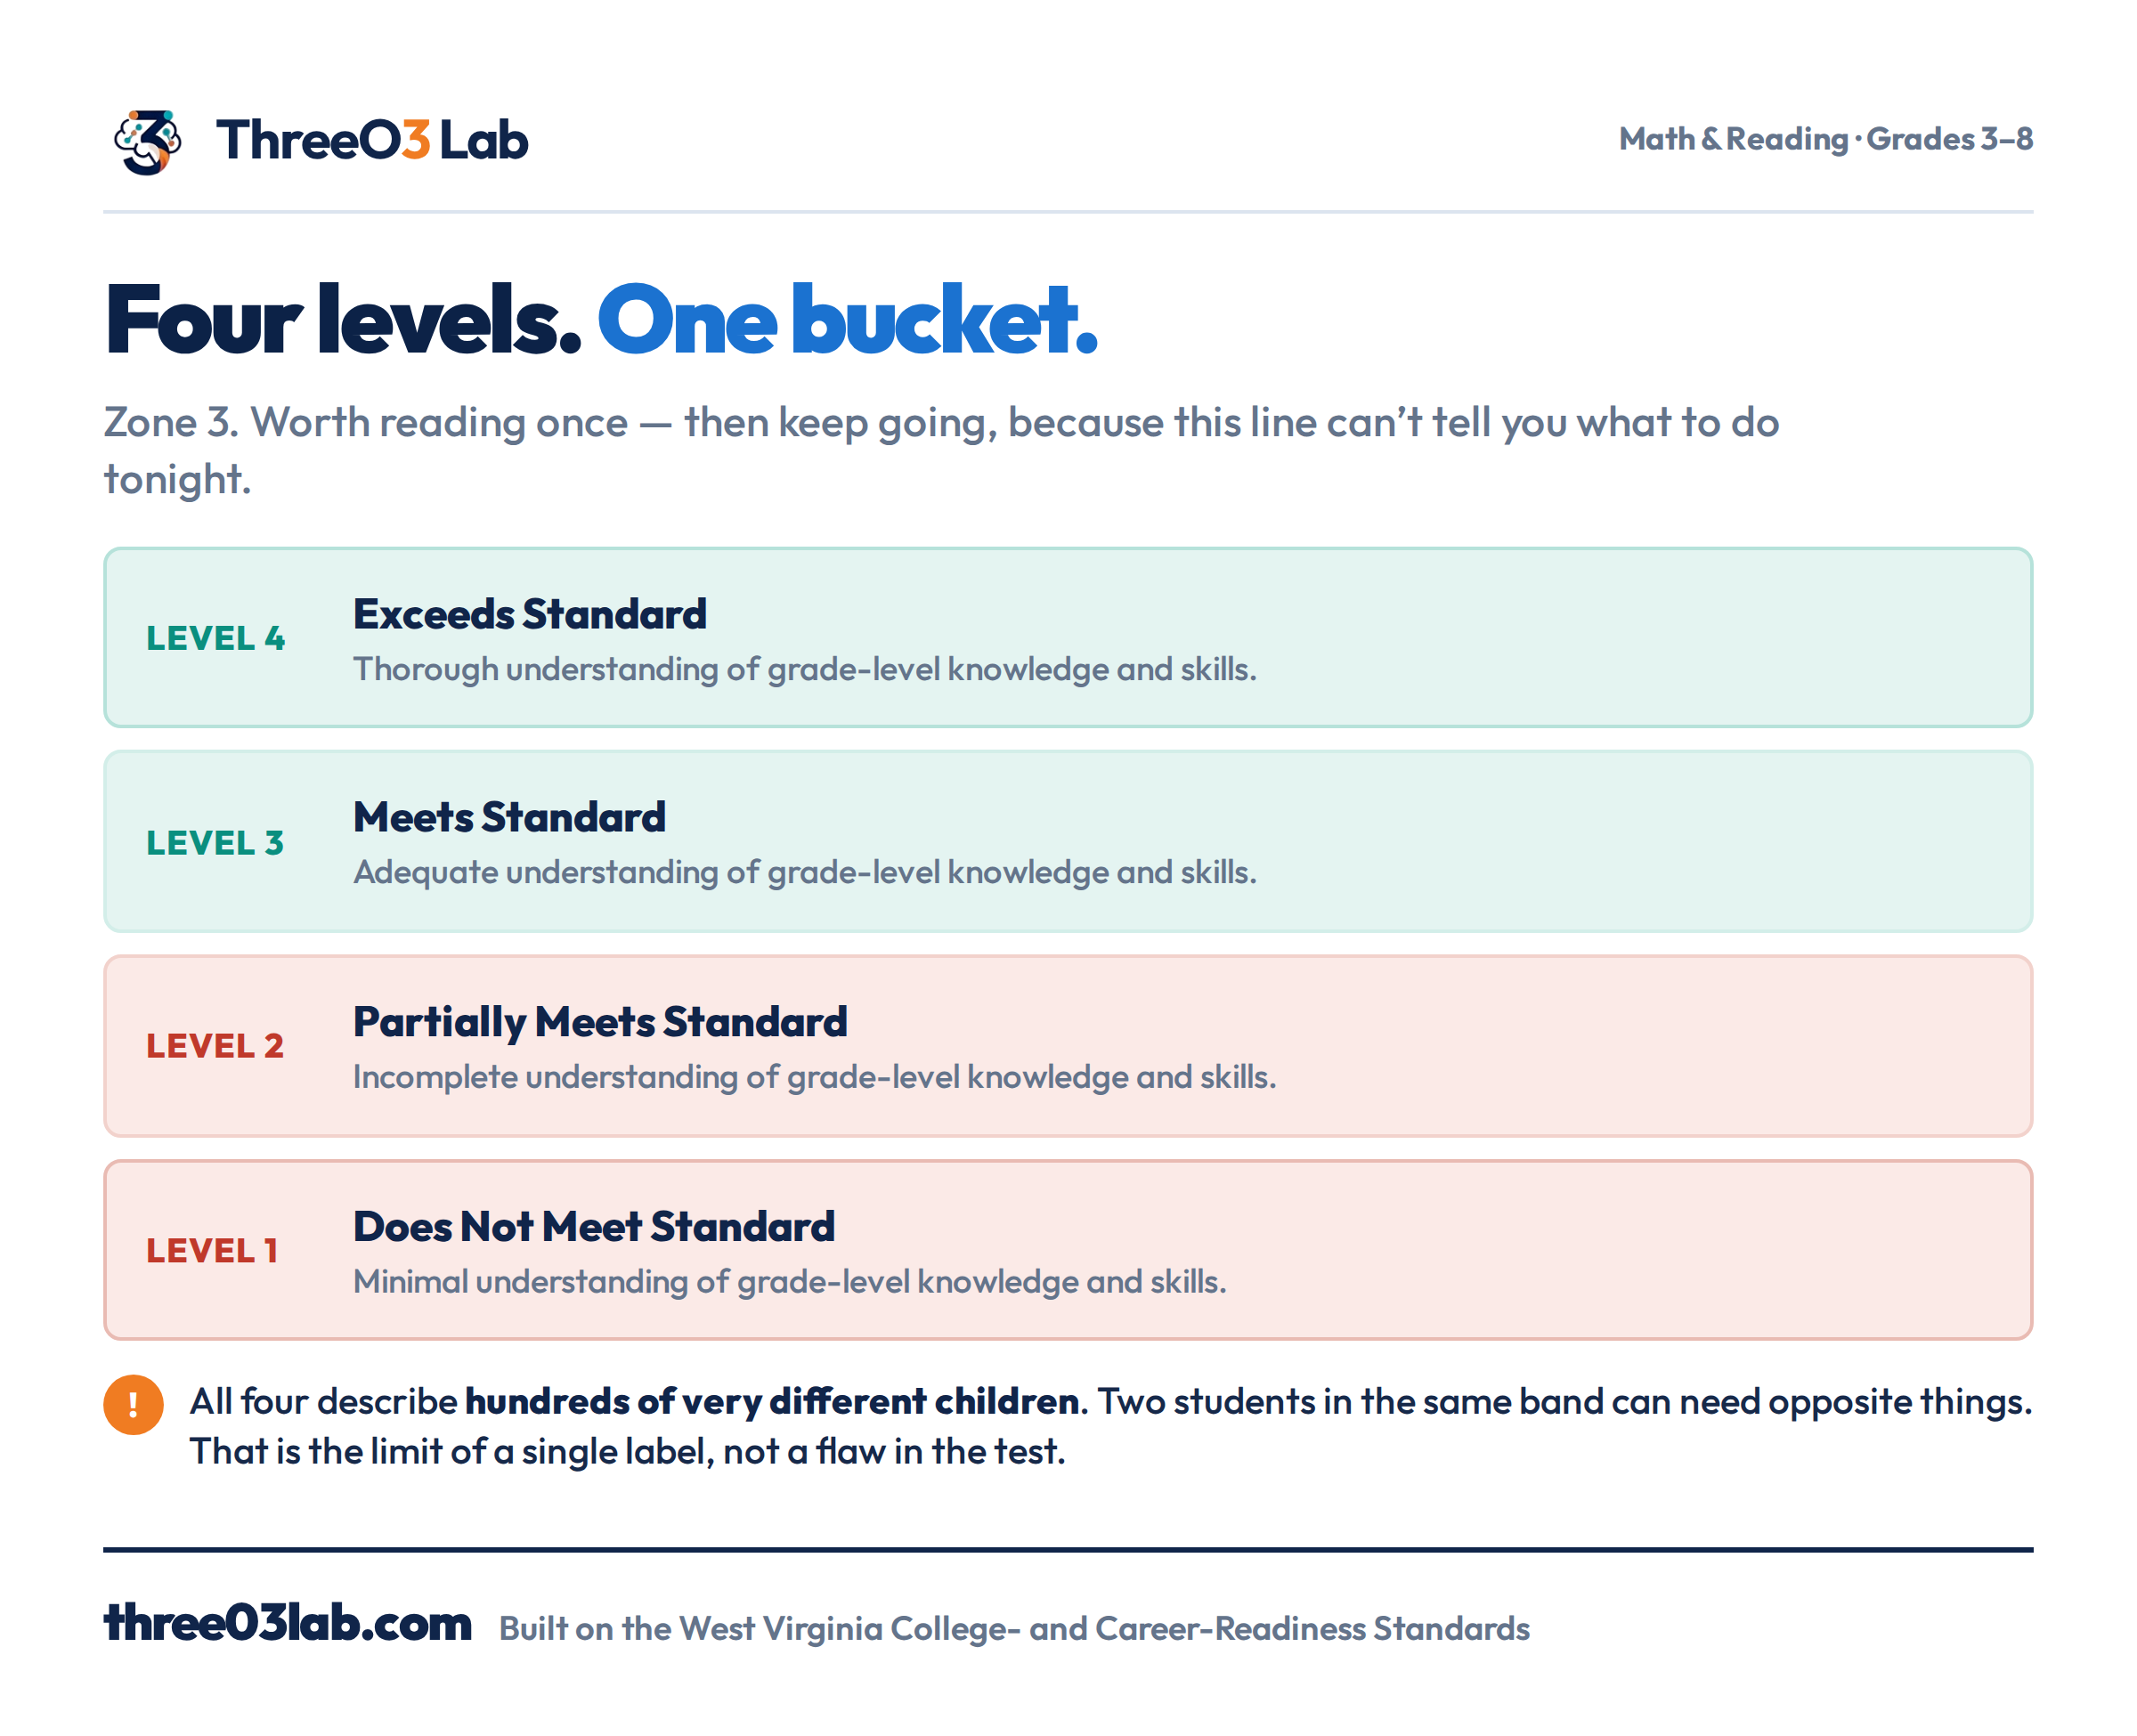
This is the line everyone reads, and it’s the line that helps least.
It’s a bucket. It tells you roughly where your child sits against grade-level expectations, which is worth knowing once. It doesn’t tell you anything actionable, because each of those four bands contains hundreds of children whose situations have nothing in common. Two students inside the same band can need opposite things.
Read it. Then keep going — the page isn’t finished with you.
Zone 5 — The reporting categories
Further down, often below the fold, there’s a table headed something like How Did Your Child Perform on Different Areas of the Test?
This is the most useful section on the page.
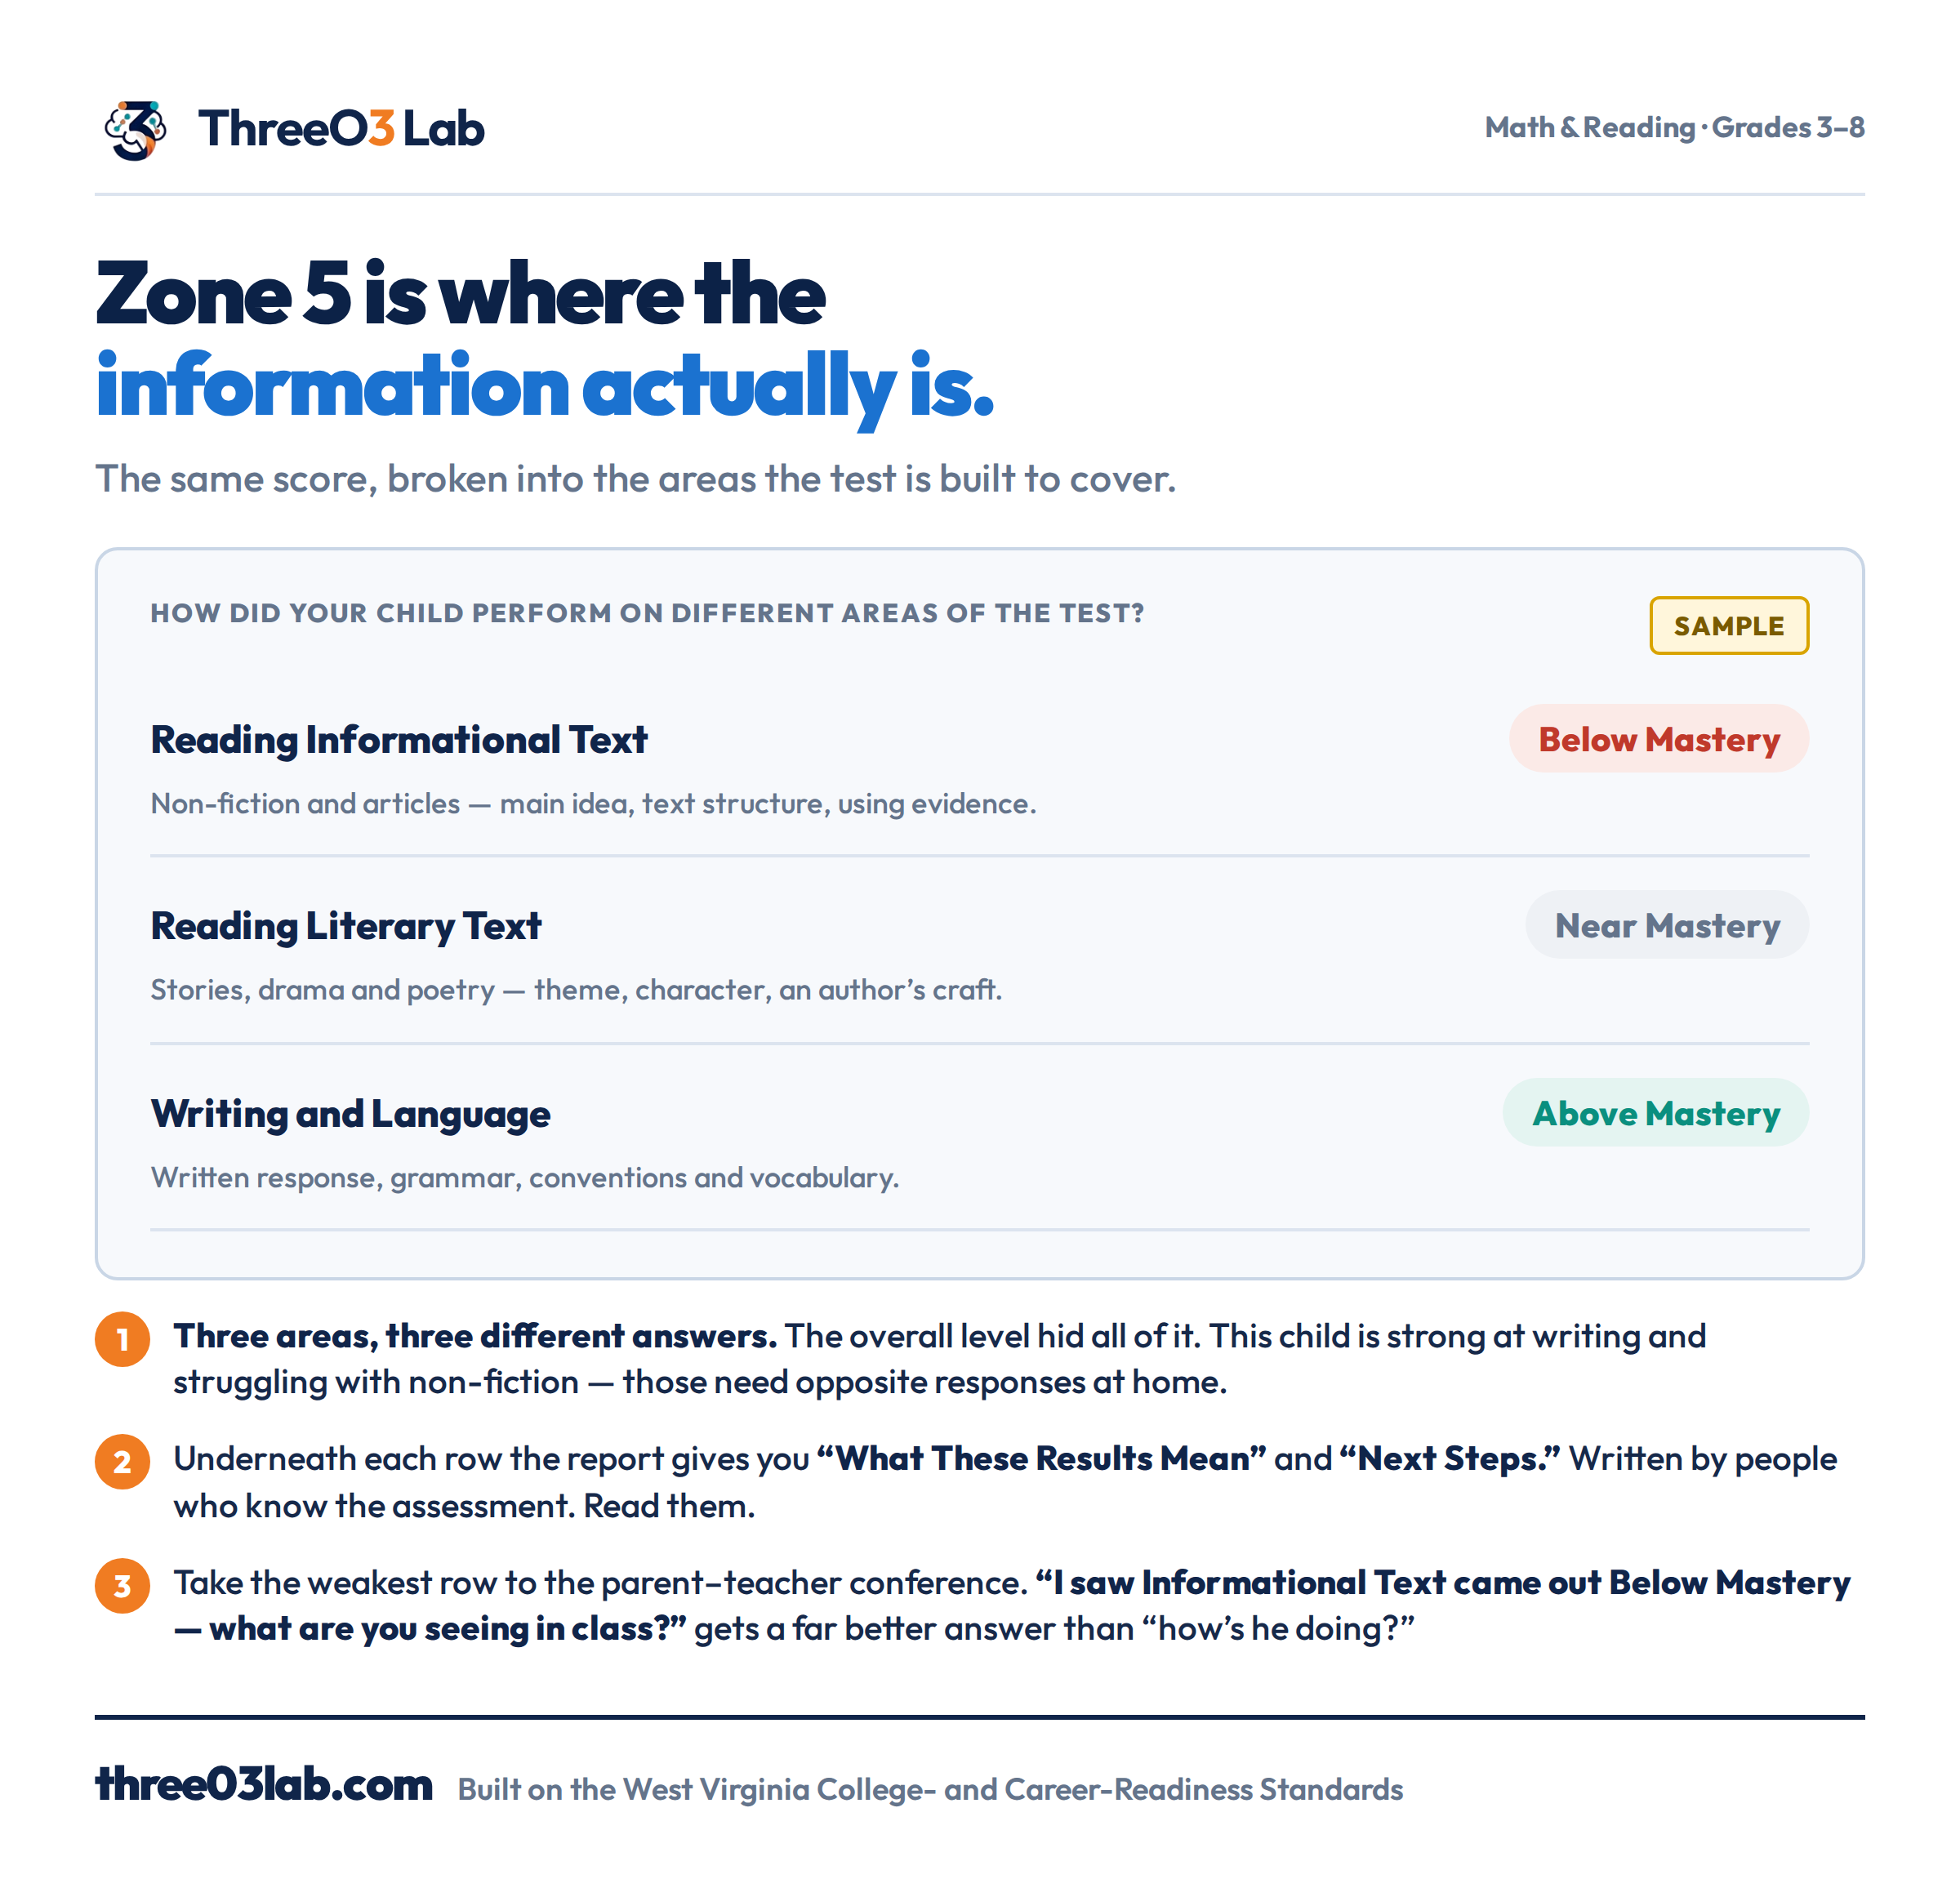
For ELA it breaks the score into three areas: Reading Informational Text, Reading Literary Text, and Writing and Language. Each gets Below Mastery, Near Mastery, or Above Mastery, with a dot and a horizontal line on either side — that line is the error bar again.
Why it matters: one overall level hides everything interesting. A child can be Above Mastery in writing and Below Mastery in informational reading and still come out as “Partially Meets” overall. Those two findings call for completely different responses at home, and the headline erases both.
Underneath each row the report gives you What These Results Mean and Next Steps — a plain-English description of what your child can generally do, plus a suggested activity. Those paragraphs are written by people who know the assessment, and they’re worth reading properly.
Zone 6 — Turn the page over
There’s a growth graph on the back, tracking every score since your child started taking the assessment, usually in third grade.
Hardly anyone flips the page.
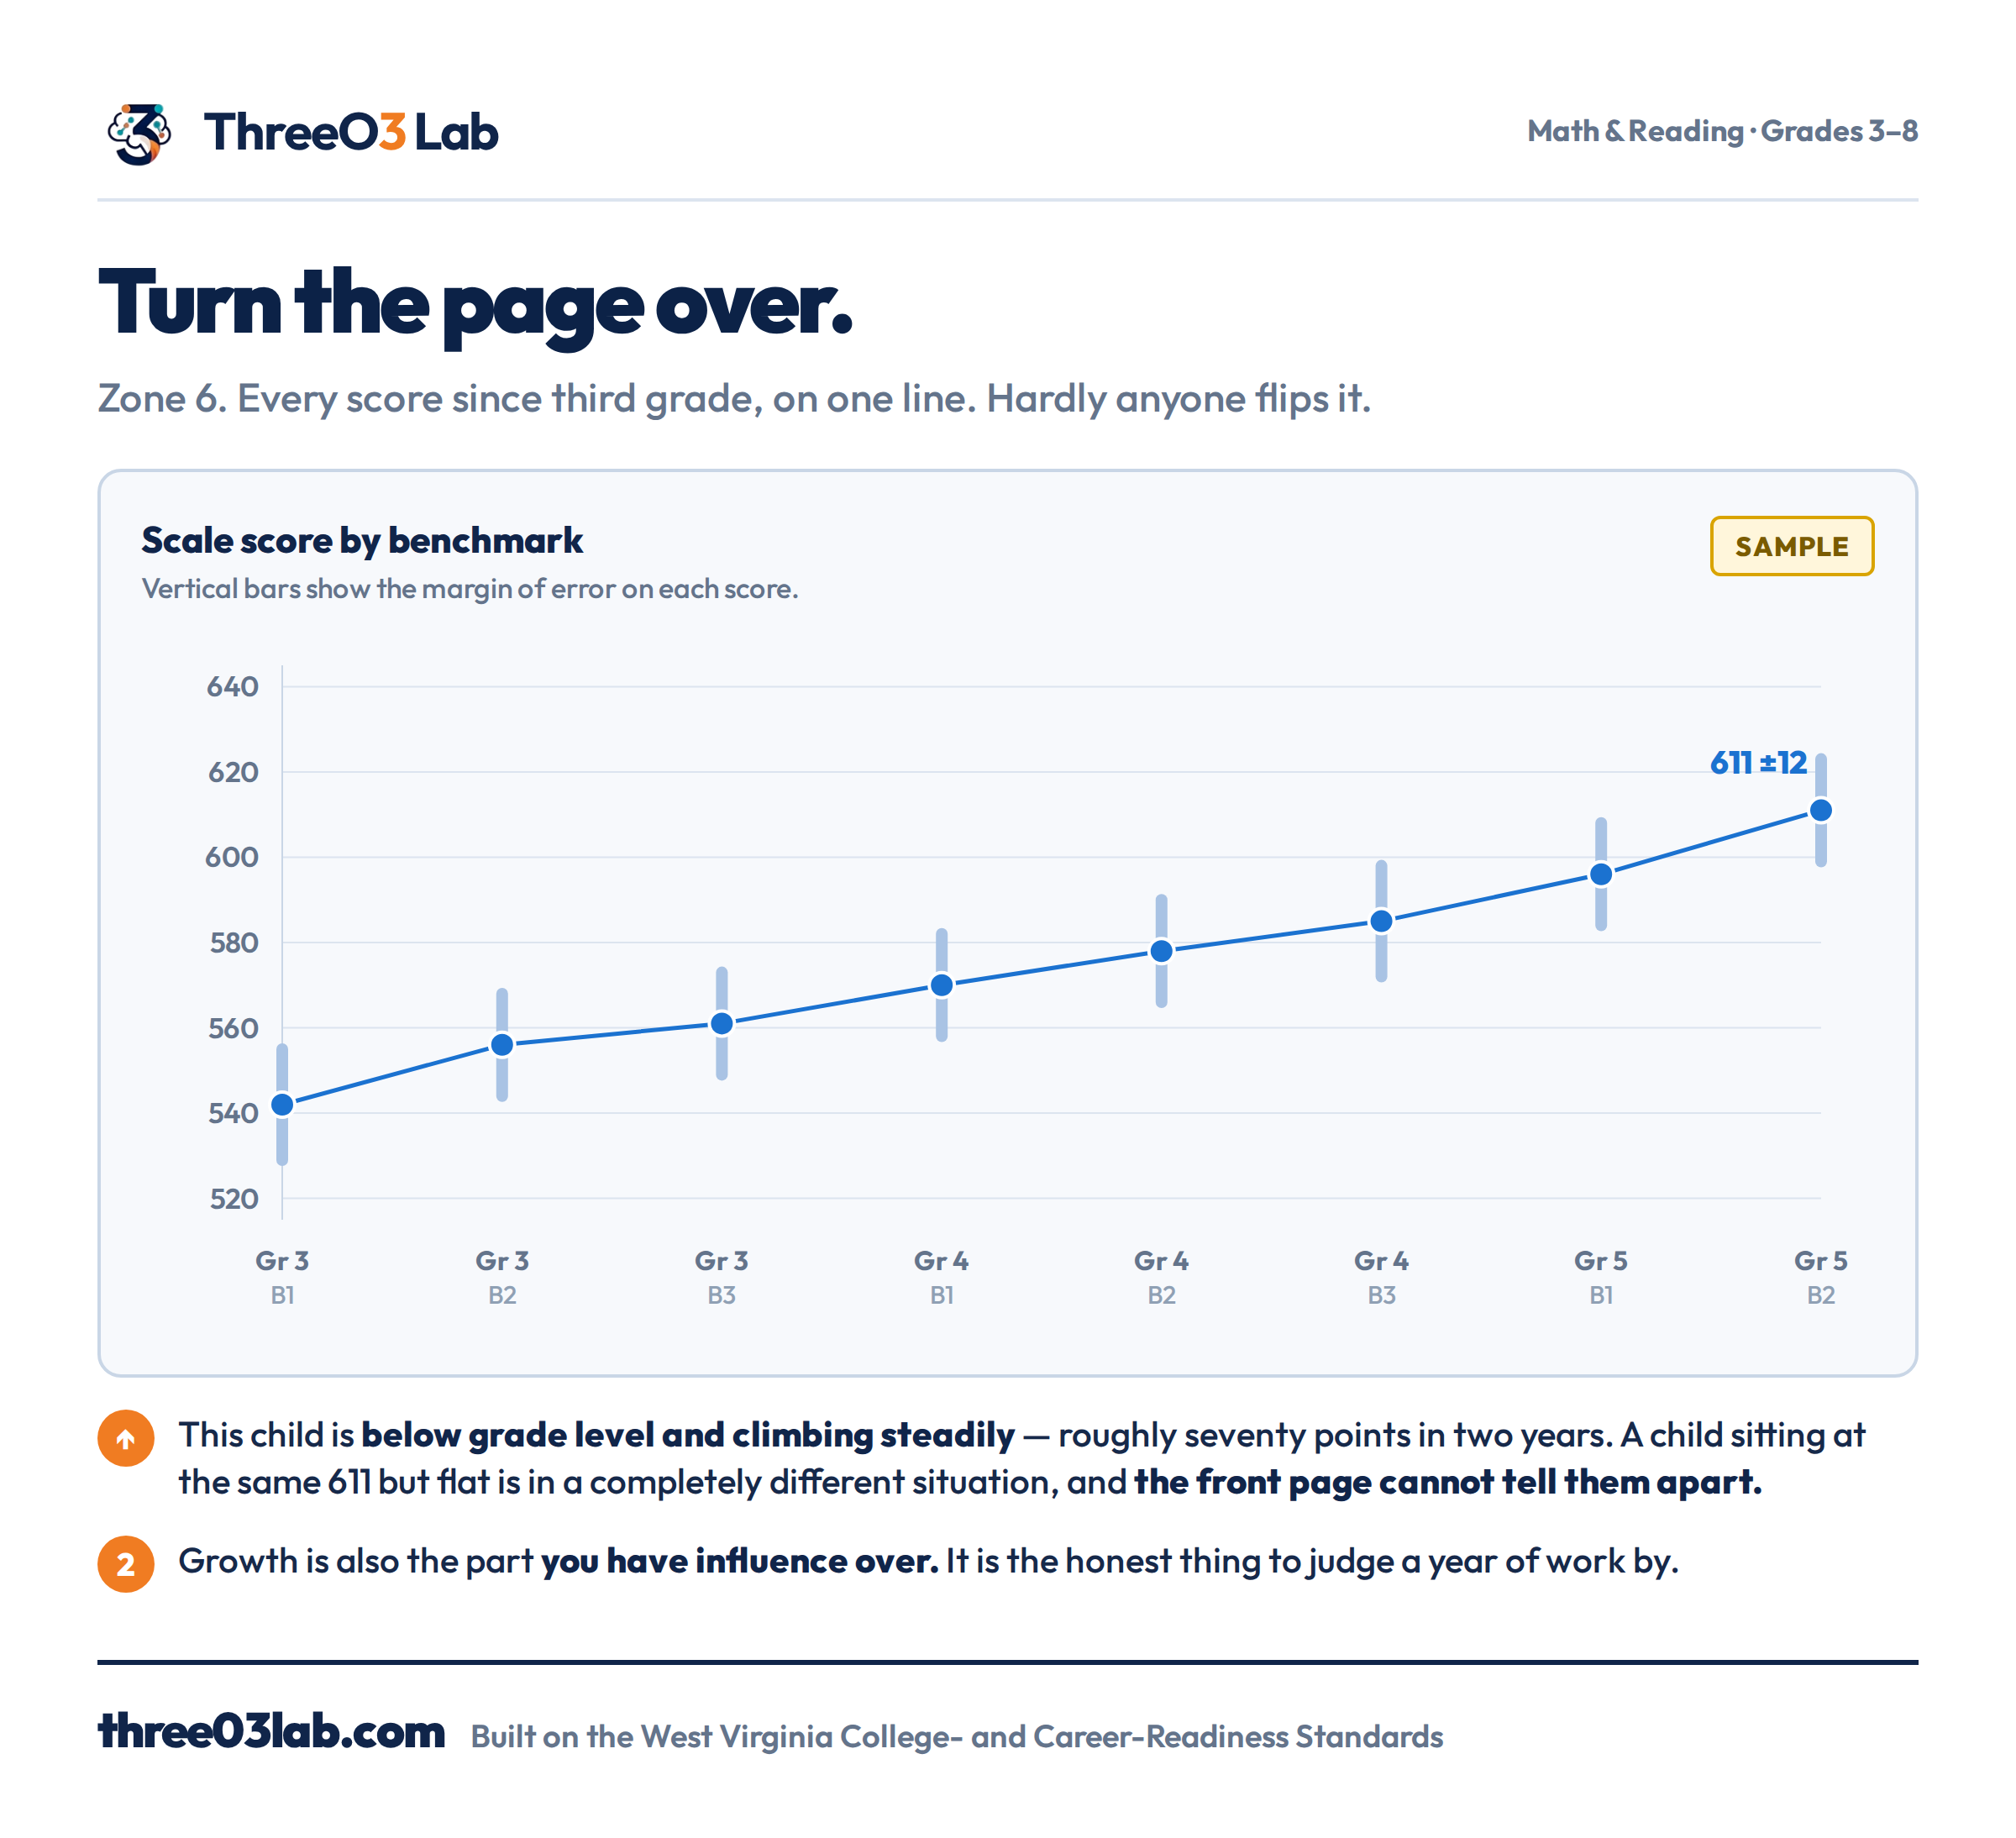
It’s frequently the most encouraging thing in the packet. A child who is below grade level but climbing steadily is in a completely different position from a child at the identical score who is flat or sliding — and the front page cannot tell those two apart.
Growth is also the part you have influence over. It’s the honest thing to judge a year of work by.
What the report cannot tell you
Everything above is genuinely useful, and none of it is a criticism of the test or of the school. The report does exactly what it was built to do.
But it stops at the category.
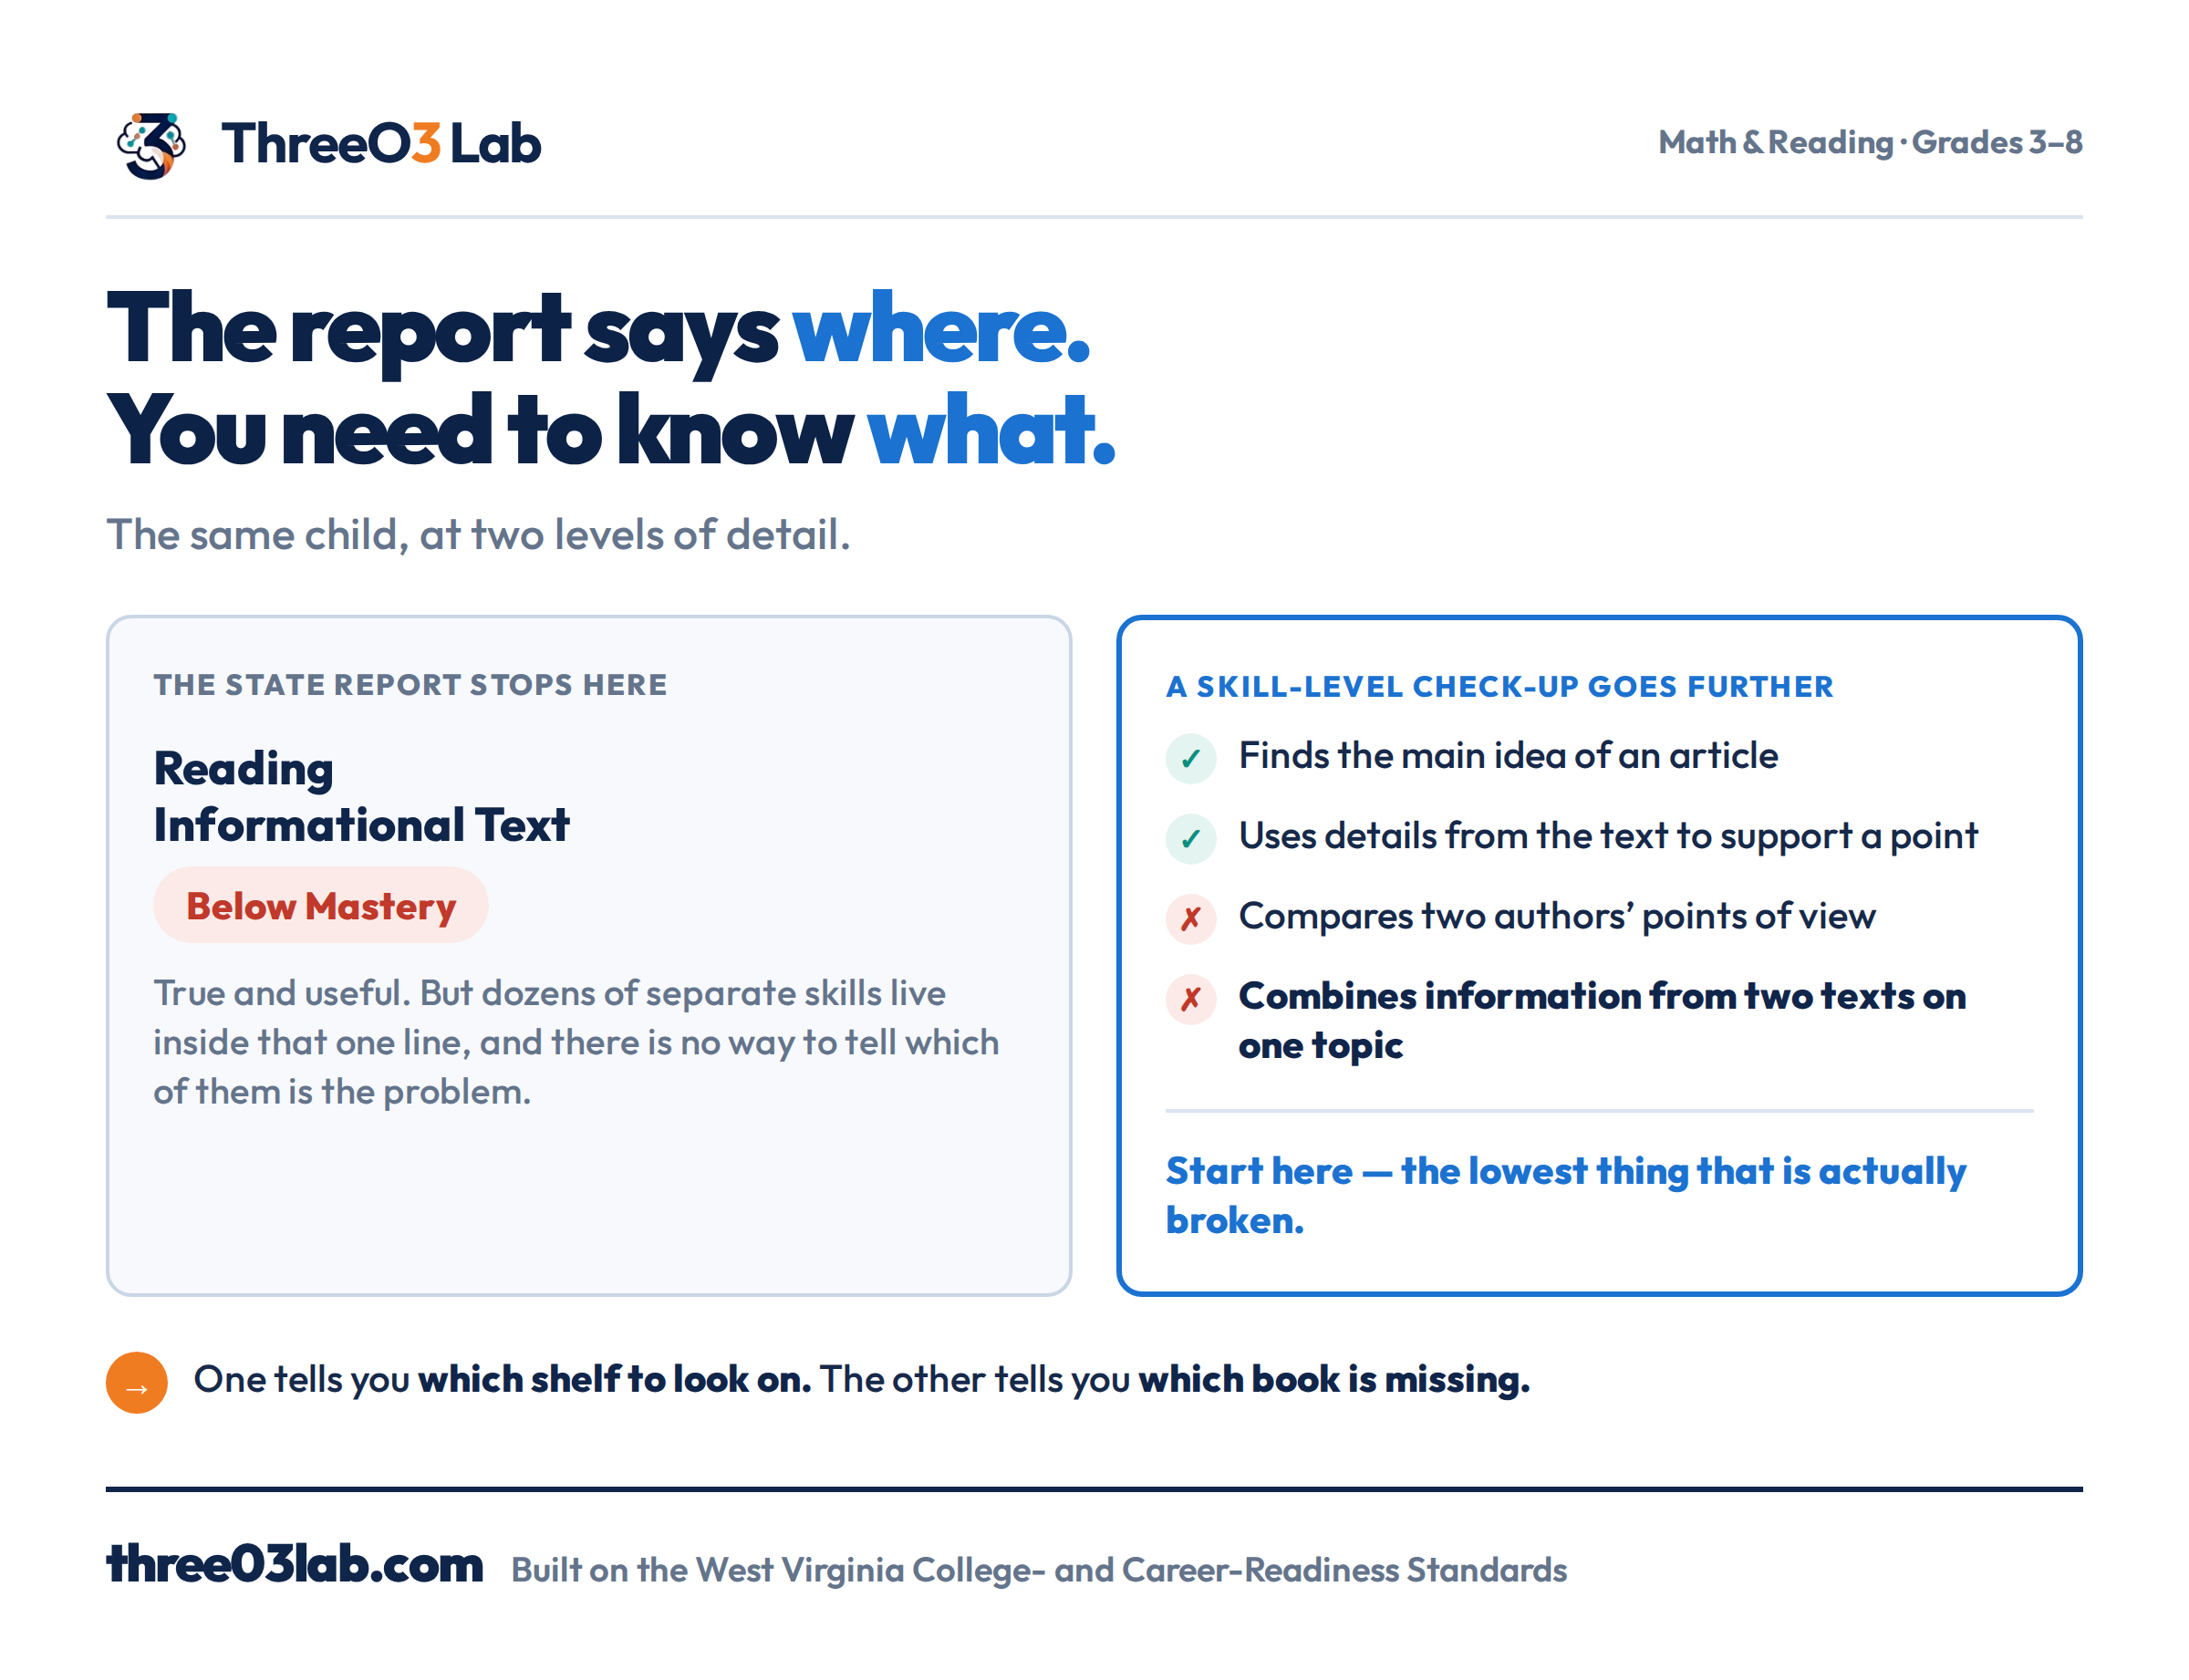
“Reading Informational Text: Below Mastery” is true, and it narrows things usefully. It also covers dozens of distinct skills — finding a main idea, tracing an argument, comparing two authors’ points of view, combining information across texts, working out a word from context. A child can be comfortable with four of those and stuck on the fifth, and the report reads exactly the same either way.
There’s a good statistical reason for this. On an adaptive test, an individual student answers too few questions per standard for a standard-level result to be reliable. The category is the finest grain the test can honestly report. Going finer would mean reporting noise as though it were signal — which is precisely the mistake this article has been warning against.
So the report tells you which shelf to look on. It can’t tell you which book is missing.
And there’s a second gap underneath it
A fifth grader struggling with fifth-grade material is often not stuck on fifth-grade material.
The standards are a chain. Each one sits on top of earlier ones, and a gap two grades back keeps propagating upward while the class moves on. The test is a snapshot of this year, so it doesn’t go looking backwards. Nothing in the packet does.
How Three03Lab prepares a child for this test
This is the part where a company usually says “aligned to state standards” and moves on. Here’s what we actually do, and why the shape of it matters.
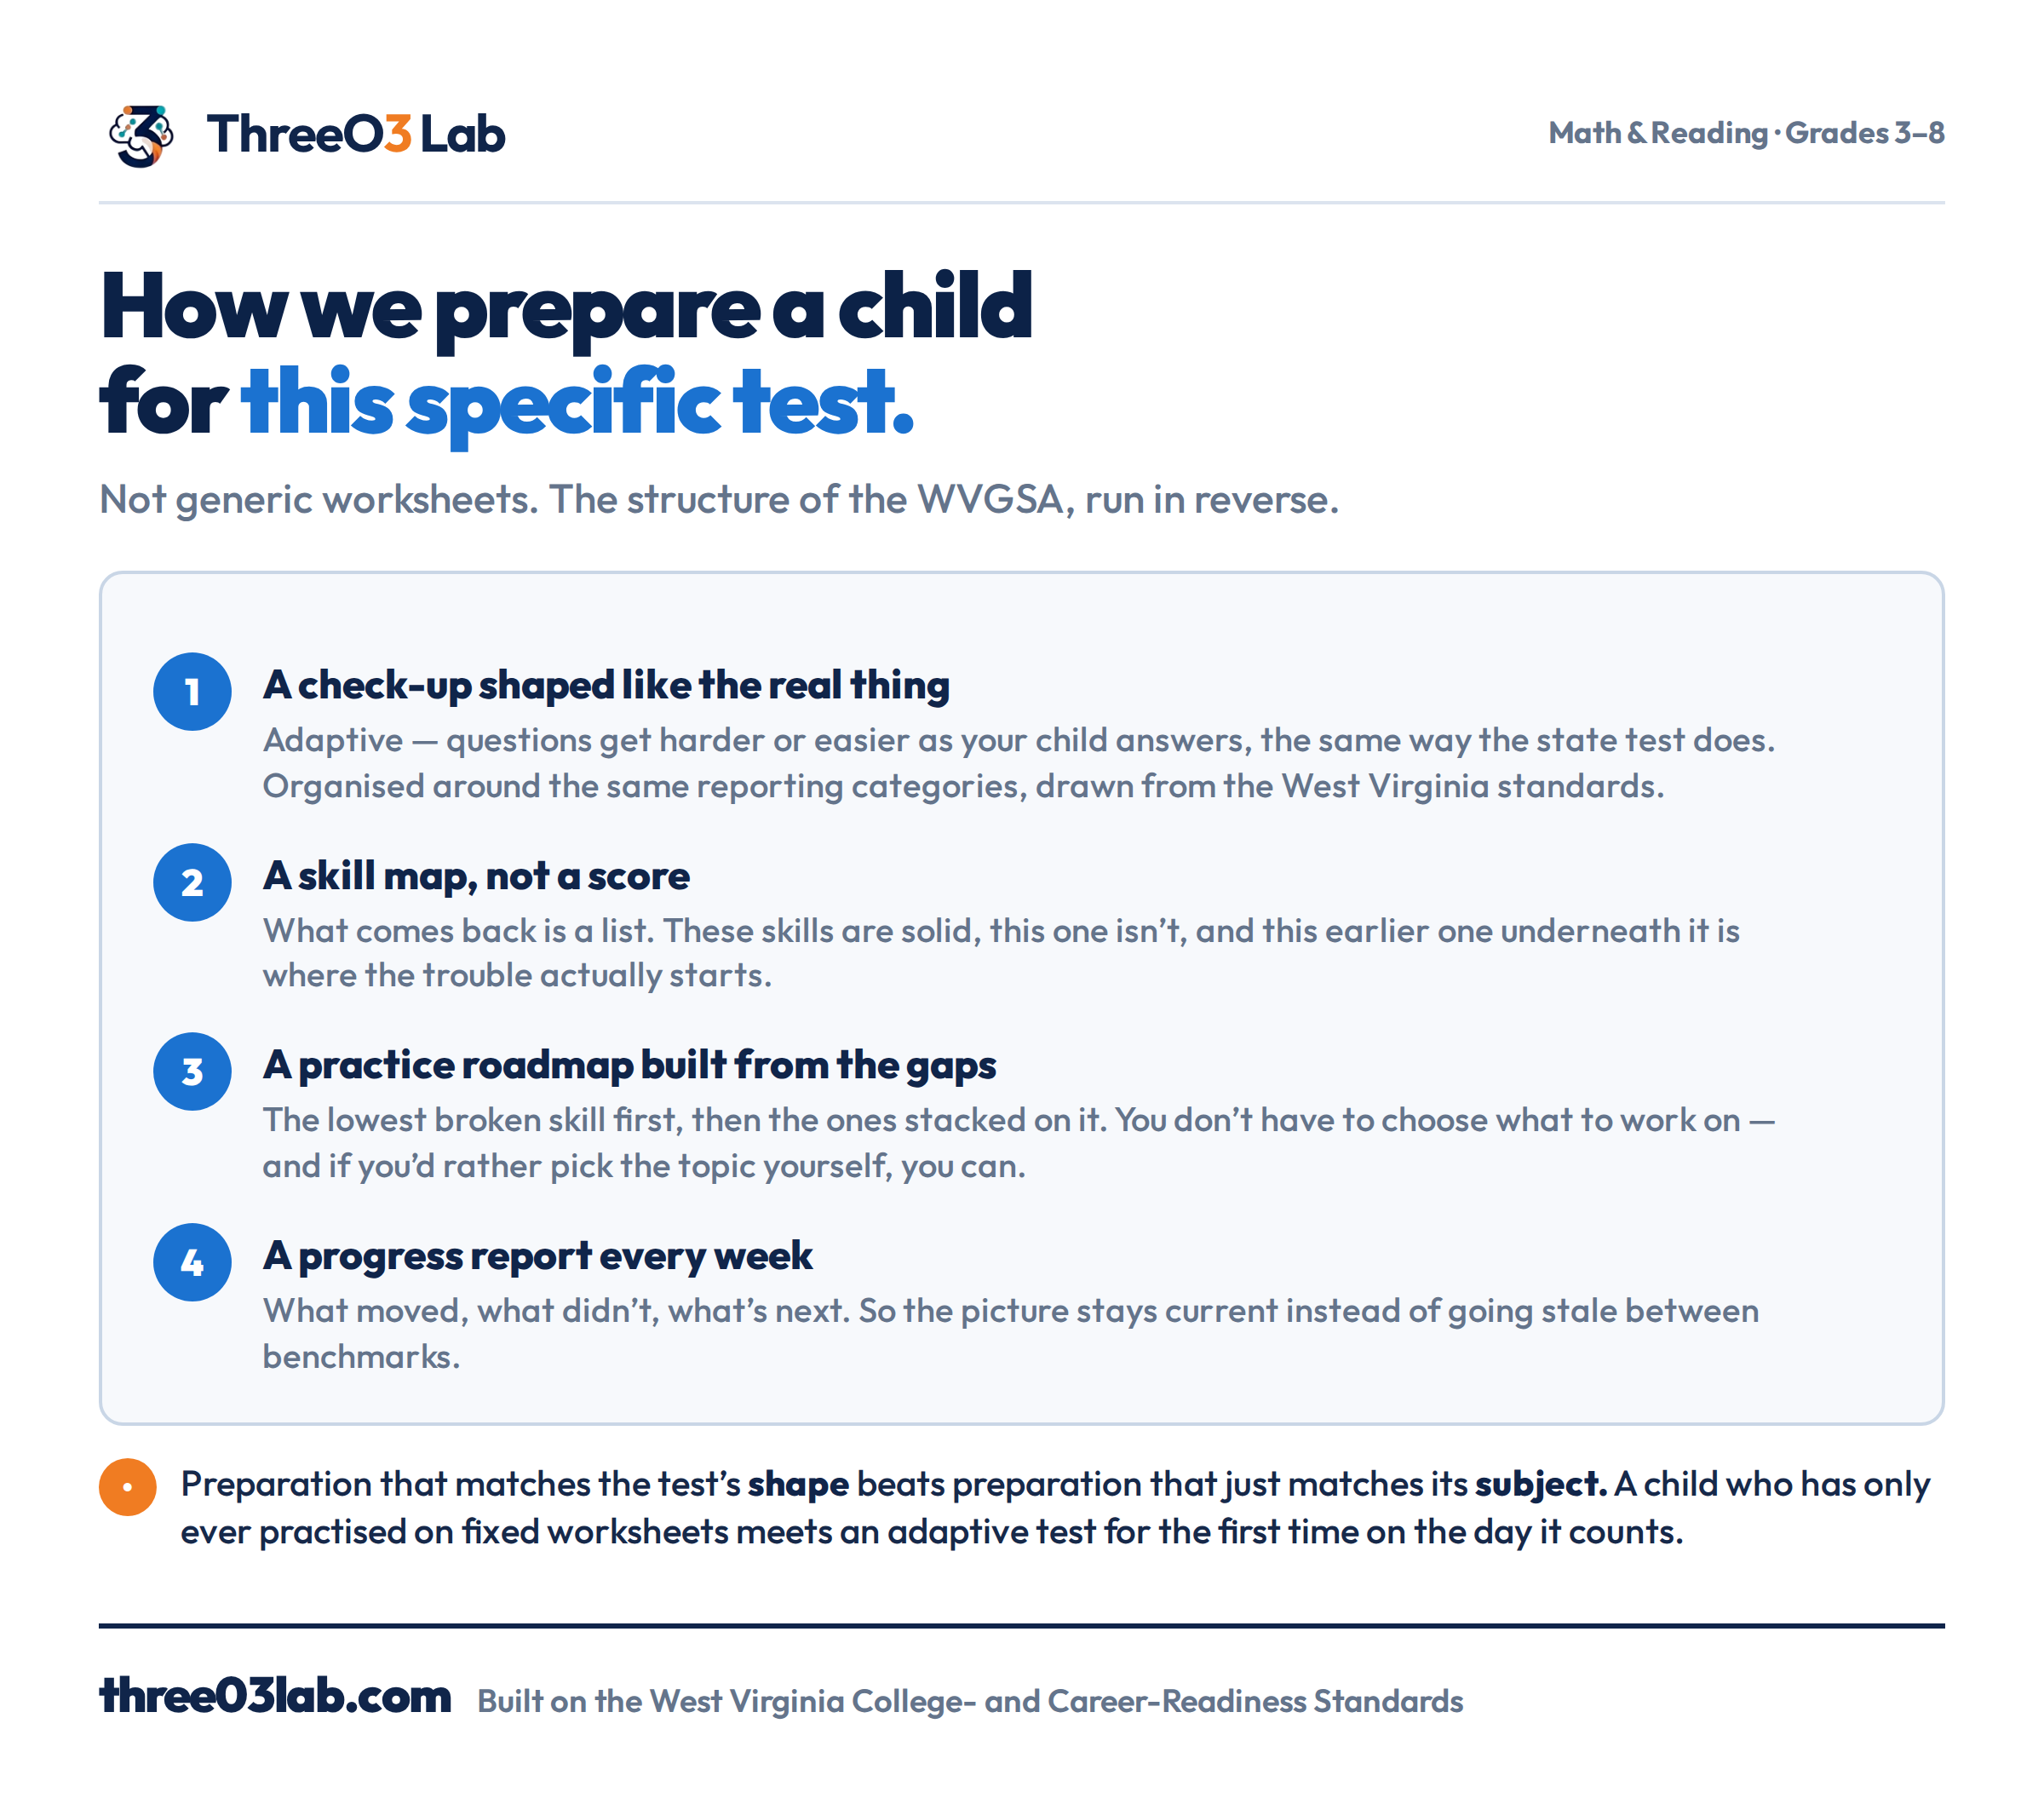
The check-up is shaped like the real test. It’s adaptive — questions get harder or easier as your child answers — and it’s organised around the same reporting categories the WVGSA is built around, drawn from the West Virginia standards rather than a national workbook.
That matters more than it sounds. A child who has only ever practised on fixed worksheets meets an adaptive test for the first time on the day it counts. Getting questions that keep adjusting to you is a genuinely different experience, and it’s worth having met it before April.
What comes back is a map, not a score. Which skills are solid, which aren’t, and which earlier ones underneath them are where the trouble actually starts.
Practice is built from the gaps, lowest first. You don’t have to decide what to work on. If you’d rather choose the topic yourself, you can.
A progress report arrives every week, so the picture stays current instead of going stale between benchmarks.
What a granular report looks like
This is the part the state report can’t do, so it’s worth showing rather than describing.
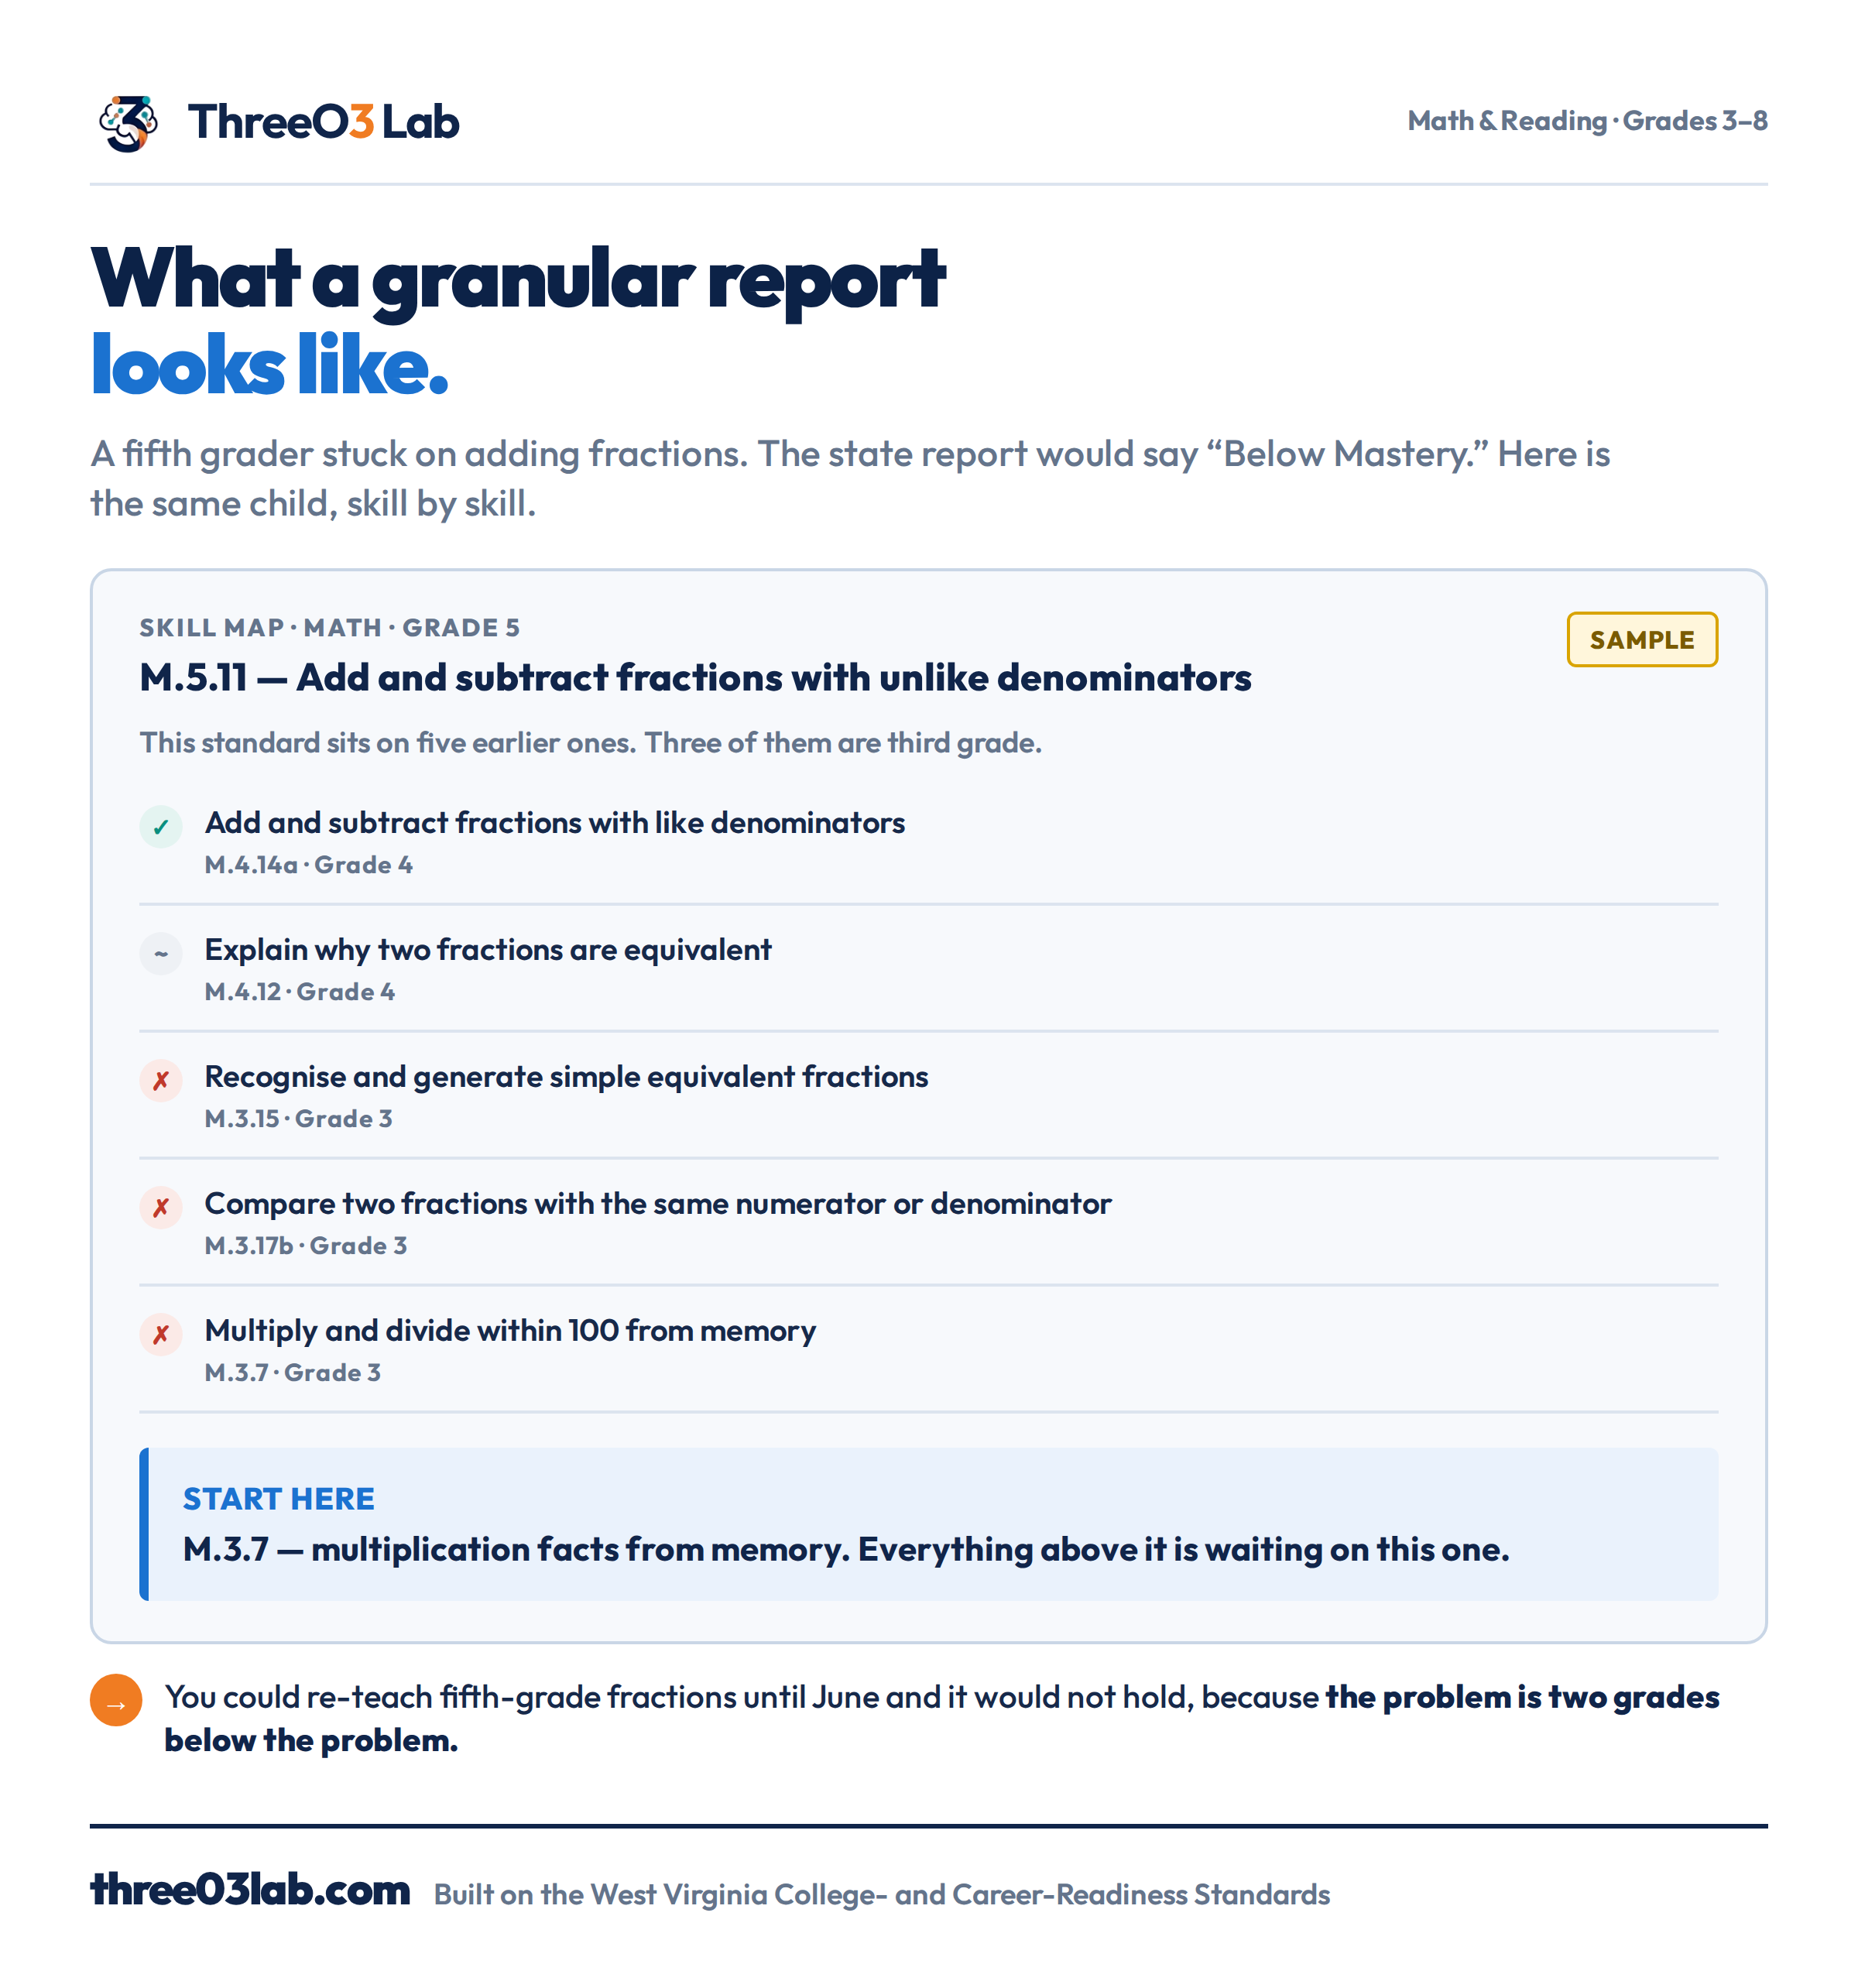
A fifth grader is struggling with adding fractions with unlike denominators. The state report would say Below Mastery and stop.
The West Virginia standard is M.5.11, and it doesn’t stand alone — it sits on five earlier standards, and three of those are third grade. So the skill map doesn’t just check M.5.11. It walks down the chain and tests each prerequisite underneath it.
In the example above, the child is fine on fourth-grade fractions and shaky underneath. The lowest broken link is multiplication facts from memory — a third-grade standard — and everything above it is waiting on that.
You could re-teach fifth-grade fractions until June and it wouldn’t hold, because the problem is two grades below the problem. That’s the thing a category-level report is not built to find, and it’s the reason we built ours to go looking.
What to do with the report tonight
- Find the ± and say the range out loud. It stops you over-reading one number.
- Skip past the achievement level to the category table. That’s the information.
- Read the “Next Steps” paragraph for the weakest category — it’s a real, specific suggestion.
- Turn the page over and look at the growth graph.
- Write down the weakest category and take it to the conference.
- Use the Lexile at the library. Ten minutes, immediate payoff.
- Find the specific skill. That’s step seven, and it’s the one the packet can’t do for you.
Three03Lab is math and reading for grades 3–8, built on the West Virginia College- and Career-Readiness Standards, made by a parent here in Jefferson County. Fourteen days free, no credit card.
Find the skill behind the score
Start the free check-up — adaptive, built on the WV standards, and it walks down the prerequisite chain.
Frequently asked questions
What does the ± mean on my child’s WVGSA scale score?
It’s the standard error of measurement. A score of 611 ±12 means the best estimate of your child’s ability is the range 599 to 623, not the single number 611. It’s the test reporting its own precision honestly.
What does “Below Mastery” mean on a WVGSA report?
It’s a rating for one reporting category — a broad area such as Reading Informational Text — indicating performance in that area fell short of grade-level expectations. It describes the whole category, not any single skill inside it.
What are the four WVGSA achievement levels?
Does Not Meet Standard, Partially Meets Standard, Meets Standard, and Exceeds Standard. Each describes how thoroughly a student demonstrates grade-level knowledge and skills relative to the West Virginia College- and Career-Readiness Standards.
Why doesn’t my child’s report show a percentage or a number correct?
The WVGSA is computer-adaptive, so no two students see the same questions, and it’s scored with item response theory rather than raw percent correct. A harder question contributes more to the score than an easier one, which means “questions correct” wouldn’t be comparable between students.
Should I be worried about one low score?
A single administration is a snapshot with a margin of error attached. Look at the category breakdown to see where the difficulty actually sits, and the growth graph on the back for direction of travel. A child below level and climbing is in a very different position from one who is flat, and the headline score can’t distinguish them.
Can the report tell me which specific skill my child is missing?
No. It reports at the category level, because an individual student answers too few questions per standard for a standard-level result to be statistically reliable. A separate diagnostic built for that purpose can go a level deeper and check the prerequisite standards underneath.
How can my child practise for an adaptive test?
With adaptive practice. Fixed worksheets don’t rehearse the experience of questions that adjust to you, and that experience is unfamiliar the first time a student meets it. Practice organised around the same reporting categories the test uses is closer to the real thing than a general workbook.